Business Intelligence Services and Solutions
Intuitive Dashboards. Automated Reporting. AI-Enabled Insights.
Are your dashboards information overload instead of clarity?
We deliver intelligent decision boards featuring unified metrics, intuitive interfaces, AI-powered natural language capabilities, and self-service tools that surface the insights that matter most.
Do your reports lack consistency and a clear data story?
We establish a single source of truth through automated real-time ETL pipelines and quality frameworks, ensuring every stakeholder works from the same reliable foundation.
Are legacy pipelines blocking real-time data access?
Our pre-built accelerators, proven frameworks, and industry-ready dashboards compress months-long projects into weeks, putting actionable intelligence in your hands faster.
Transforming Dashboards into Growth Drivers with Advanced Data Visualization
Enterprises often struggle to make sense of growing data. Data Visualization and Business Intelligence unify information into a single source of truth, delivering clear insights into performance, trends, and opportunities. As organizations move toward AI-driven decision-making, Gartner predicts that by 2027, 75% of new analytics content will be contextualized using Generative AI, making analytics more intelligent, adaptive, and action-oriented.
Our Business Intelligence services span platform development, modernization, and end-to-end data visualization using Power BI and Tableau. We go beyond traditional reporting with intuitive real-time dashboards, automated reporting, and AI/Copilot-ready insights.
Schedule a Call
Our Industry Specific BI Solutions
Manufacturing
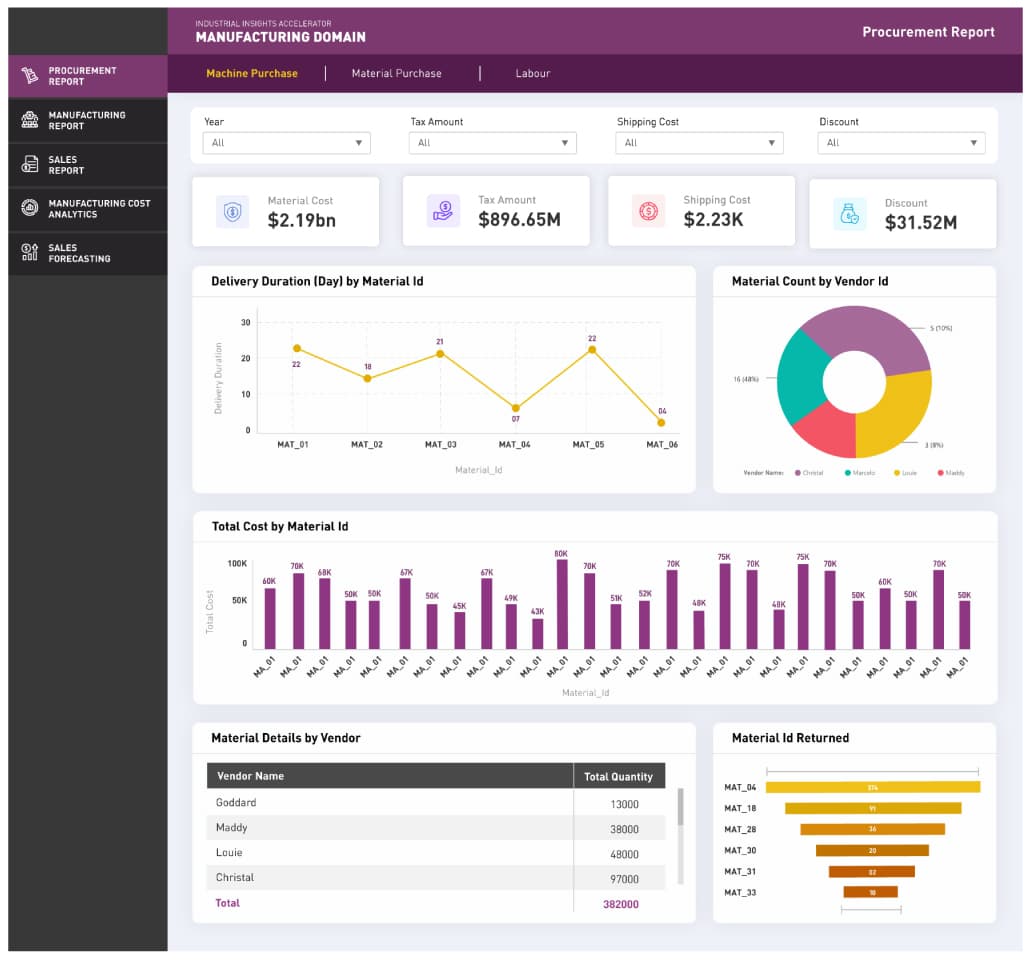
Track production efficiency, yield, defects, and shift-level performance.
Monitor supply chain performance, inventory levels, and procurement cycles.
Analyze material purchasing trends, cost fluctuations, and supplier reliability.
Assess labor productivity through shift insights, attendance, and cost allocation.
Analyze downtime drivers, MTTR/MTBF patterns, and their impact on throughput.
Monitor manufacturing cost drivers across labor, materials, and machine.
Forecast sales demand using historical trends and predictive modeling.


Specialized Business Intelligence Services
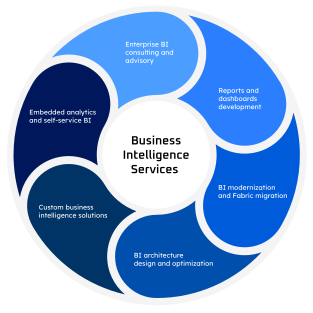
Enterprise BI consulting and advisory
Reports and dashboards development
BI modernization and Fabric migration
BI architecture design and optimization
Custom business intelligence solutions
Embedded analytics and self-service BI
Implementation Roadmap
Requirements Discovery and KPI Definition
Visualization Strategy and Platform Architecture
Automate infrastructure and deployment
Semantic Layer Design and Data Modeling
Dashboard and Report Development
Data Refresh and Performance Optimization
Transforming Sales and Inventory Visibility with Power BI
For a leading U.S. automotive dealer, fragmented reporting, inconsistent data quality, and limited visibility into buyer behavior and inventory performance restricted data-driven decision-making. By implementing Power BI with embedded analytics, Power Query, and AI-powered forecasting, LevelShift delivered a centralized analytics platform that improved reporting accuracy, inventory planning, and sales visibility.
Read the full storyImproved Sales & Inventory Visibility
Delivered interactive Power BI dashboards that provided real-time insights into buyer behavior, sales performance, and inventory trends.
Higher Data Quality & Reporting Accuracy
Standardized data preparation with Power Query to create consistent, reliable datasets for business reporting and analytics.
Smarter Inventory Planning
Integrated Python-based demand forecasting into Power BI, enabling proactive stock planning and reducing the risk of overstocking and stockouts.
Why LevelShift
- Microsoft Specialized Partner for Analytics, Data Warehouse Migration, and Low-Code Solutions
- Library of 100+ prebuilt industry dashboards across PMO, hospitality, finance, retail, healthcare, insurance, and manufacturing
- Accelerators for SSRS-to-Power BI migration, SSIS metadata migration, and Tableau-to-Power BI metadata conversion
- Copilot enablement built on governed semantic models for accurate, natural language insights






Where are you in your Data Transformation Journey?
Learn More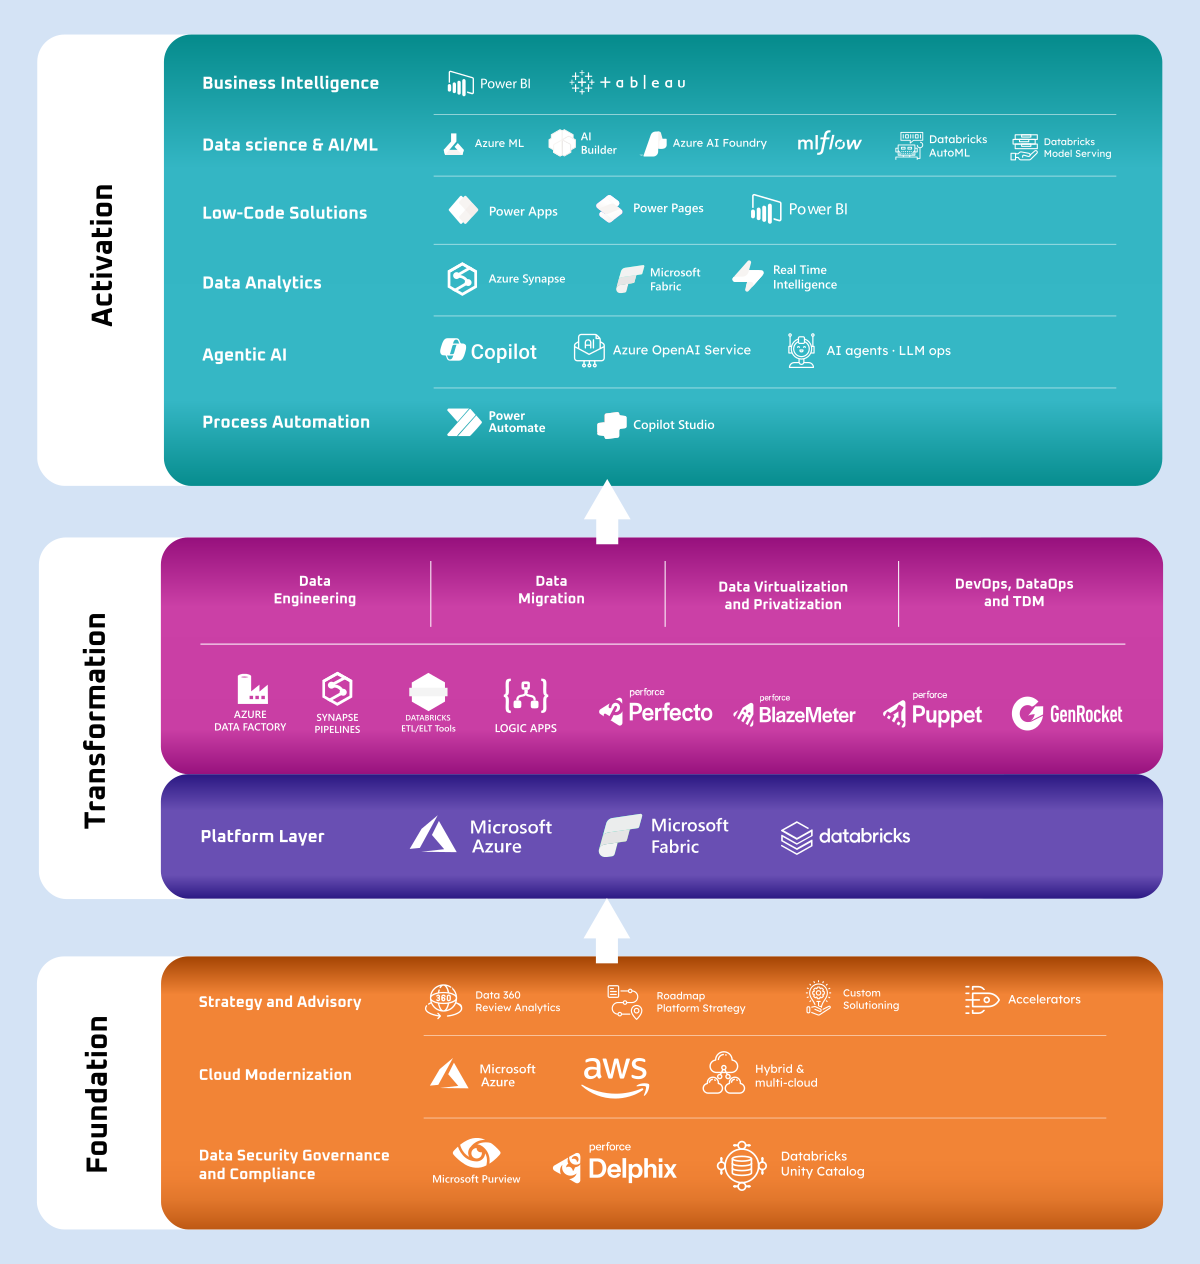
FAQs
Business Intelligence (BI) transforms data from across the enterprise into interactive dashboards, reports, and visualizations that help organizations monitor performance and make informed decisions. While reporting focuses on presenting historical information, Business Intelligence provides interactive exploration, drill-down analysis, and real-time visibility into key metrics. Data analytics extends this further by identifying patterns, predicting outcomes, and uncovering the reasons behind business performance using statistical and machine learning techniques.
At LevelShift, we build modern Business Intelligence solutions using Microsoft Power BI, Microsoft Fabric, and Tableau, enabling organizations to move beyond static reports to governed, self-service analytics that support faster and more confident decision-making.
Self-service Business Intelligence enables business users to explore data, build reports, and answer questions independently without relying on IT for every request. However, without proper governance, it can lead to inconsistent metrics, duplicate reports, and data security risks.
LevelShift enables self-service BI by combining centralized governance with controlled user access. Using Microsoft Fabric, Power BI, Microsoft Purview, semantic models, and role-based security, we establish a trusted data foundation where business users can confidently create insights while IT maintains data quality, security, lineage, and compliance. This approach accelerates decision-making without sacrificing governance or consistency.
Yes. Modern Business Intelligence platforms can deliver real-time dashboards by continuously integrating data from operational systems, cloud applications, IoT devices, and streaming data sources. This enables decision-makers to monitor business performance as events occur rather than relying on scheduled reports.
LevelShift develops real-time Business Intelligence solutions using Microsoft Fabric Real-Time Intelligence, Power BI, Azure data services, and modern data architectures. By combining live data pipelines, Direct Lake, event streaming, and automated refresh capabilities, organizations gain immediate visibility into operational KPIs, customer activity, supply chain performance, and financial metrics, enabling faster and more informed decisions.
Yes. Business Intelligence dashboards can be securely embedded into enterprise applications, customer portals, ERP systems, CRM platforms, and other business applications, allowing users to access insights without switching between multiple tools.
LevelShift develops embedded analytics solutions using Microsoft Power BI Embedded and Microsoft Fabric, integrating dashboards into applications such as Dynamics 365, Salesforce, SAP, custom web portals, and line-of-business applications. Embedded analytics improves user adoption, provides contextual insights, and enables organizations to deliver a seamless analytics experience while maintaining enterprise-grade security, governance, and role-based access controls.
A semantic model is a governed business layer that defines how enterprise data is organized, related, calculated, and presented to end users. It provides consistent business definitions, standardized KPIs, reusable calculations, and secure access to trusted data across reports and dashboards.
A well-designed semantic model is essential for modern Business Intelligence because it enables self-service analytics, improves report consistency, reduces duplicate datasets, and forms the foundation for Microsoft Copilot in Power BI and Microsoft Fabric. LevelShift designs scalable semantic models that support enterprise governance while making data easier to discover, understand, and analyze across the organization.
Preparing a Business Intelligence environment for Microsoft Copilot requires more than simply enabling AI features. Organizations need governed, high-quality data, well-structured semantic models, meaningful metadata, secure access controls, and consistent business definitions to ensure AI-generated insights are accurate and trustworthy.
LevelShift assesses data quality, semantic models, metadata, security configurations, and governance practices before implementing Microsoft Copilot for Power BI and Microsoft Fabric. By modernizing data architectures and establishing AI-ready foundations, we help organizations maximize the value of Copilot while maintaining compliance, accuracy, and enterprise governance.
The right platform depends on your business objectives, existing technology investments, data architecture, and future AI strategy. Power BI provides deep integration with Microsoft 365, Azure, and Dynamics 365, making it an excellent choice for organizations already invested in the Microsoft ecosystem. Tableau is widely used for advanced visual analytics, while Microsoft Fabric unifies data engineering, data warehousing, real-time analytics, Business Intelligence, and AI within a single SaaS platform.
LevelShift evaluates your current environment, reporting requirements, scalability needs, and modernization roadmap to recommend the platform that best supports your analytics, governance, and AI initiatives while maximizing long-term business value.