cookies preferences

Power BI Implementation Services

Elevating Power BI into a Trusted, Scalable Enterprise Analytics Platform

Talk to our Experts

Reports not aligning across teams or data sources?

Governed semantic models and standardized KPIs ensure consistent, accurate insights across the organization, so every team can make confident decisions.

Finding that Power BI adoption is limited to a few users or teams?

We implement enterprise-grade Power BI architectures that support secure self-service analytics at scale, empowering more teams to explore data and act independently.

Worried about performance, security, or maintainability?

Optimized models, robust governance, and lifecycle management safeguard performance, protect data, and ensure dashboards stay relevant as business needs evolve.

Power BI as a Governed Analytics and AI Platform

Transform Power BI from fragmented reporting into a trusted enterprise analytics foundation. We align data models, standardize KPIs, automate refresh and distribution, and enforce role-based security to enable governed self-service at scale.

With the right data architecture in place, Copilot in Power BI delivers accurate, context-aware insights grounded in trusted business metrics, turning natural language queries into reliable, actionable intelligence.

Schedule a Call

Our Power BI Services
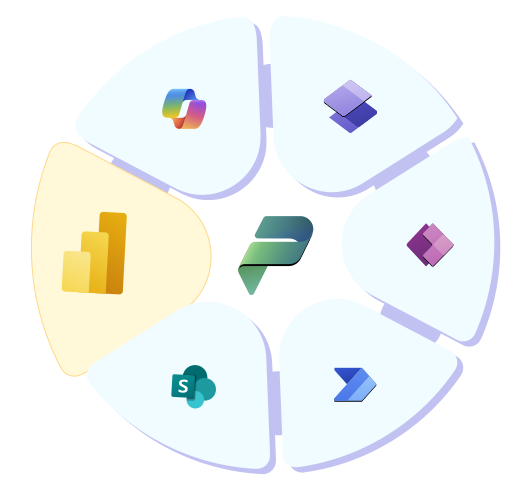
Data Analytics Services Illustration

Strategy and Architecture

Define the right Power BI architecture, workspace strategy, data model design, and governance framework aligned to enterprise needs.

Data Modeling and Semantic Layer

Design optimized star schemas, DAX measures, and certified datasets that standardize metrics across reports and teams.

Dashboard and Report Development

Build executive dashboards, operational reports, and role-based views that answer real business questions, not just display data.

Integration and Automation

Integrate Power BI with enterprise systems and automate refresh, alerts, workflows, and report distribution using Power Automate.

Governance and Security

Implement workspace governance, row-level security, access controls, monitoring, and usage analytics to protect data and scale safely.

Power BI Advanced Analytics

Enable forecasting, anomaly detection, AI visuals, and natural language queries to move from descriptive to predictive insights.

Power BI Accelerators and Migration Frameworks

Power BI Industrial Insights Accelerators

PMOHospitalityFinanceRetailHealthcareInsuranceManufacturing

Power BI to Microsoft Fabric Migration Accelerator

Learn More

Tableau to Power BI Migration Accelerator

All Industries

Our Industry Specific BI Solutions

Manufacturing

Track production efficiency, yield, defects, and shift-level performance.

Monitor supply chain performance, inventory levels, and procurement cycles.

Analyze material purchasing trends, cost fluctuations, and supplier reliability.

Assess labor productivity through shift insights, attendance, and cost allocation.

Analyze downtime drivers, MTTR/MTBF patterns, and their impact on throughput.

Monitor manufacturing cost drivers across labor, materials, and machine.

Forecast sales demand using historical trends and predictive modeling.
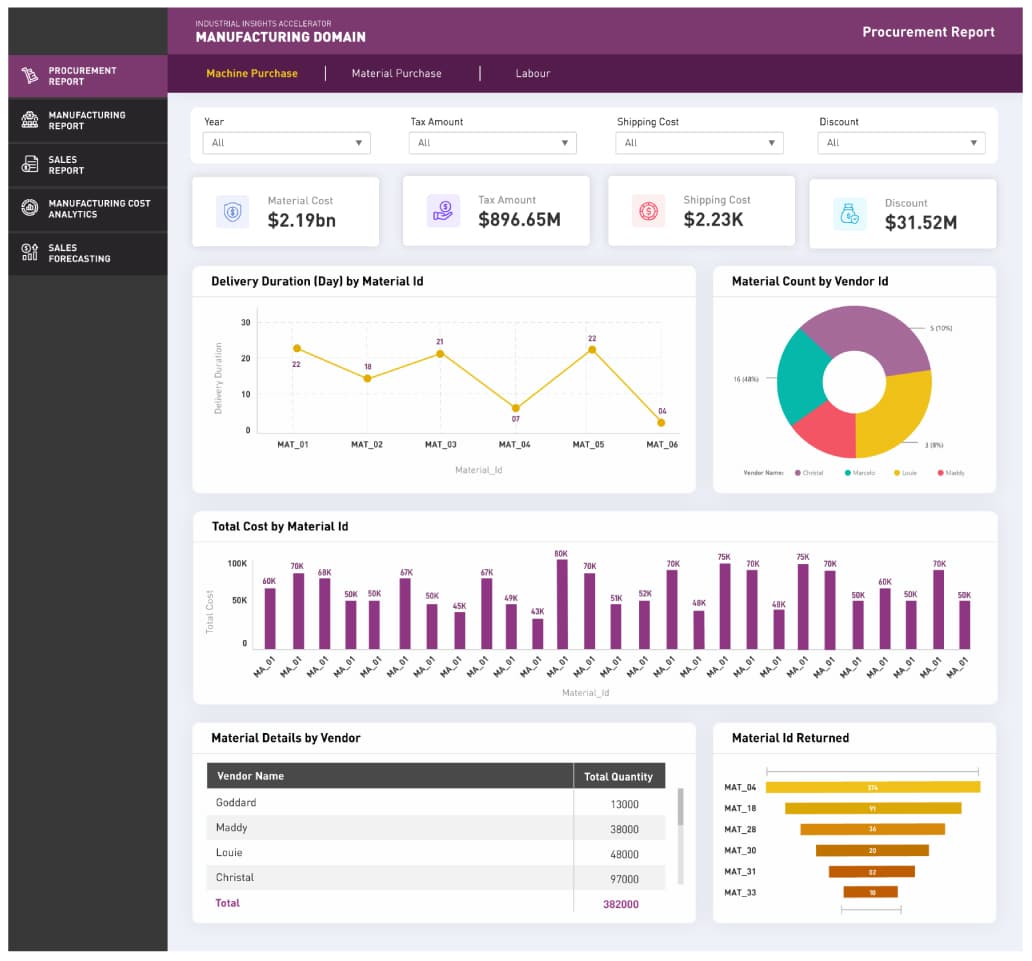
Manufacturing
Customer Impact

Modernizing sales and inventory analytics with Power BI for a leading automotive dealer

For one of the largest used-car dealers in the western U.S., inconsistent data and no standardized way to grade auction purchases made it difficult to spot buying issues or forecast demand. By building a custom grading system and demand forecasting model in Power BI, inventory decisions became data-driven, consistent, and easier to act on.

Read the full story

Clearer Visibility into Buyer and Inventory Patterns

Dedicated Power BI views turned scattered auction data into visual trends the team could act on.

Proactive, Forecast-Driven Inventory Management

A Python-powered demand forecasting model helped reduce the risk of overstocking or stockouts.

More Accurate and Reliable Reporting

Power Query standardized data cleaning and validation, resolving quality issues at the source.

Why LevelShift

  • Microsoft specialized low-code solutions partner
  • Accelerators for KPI standardization, semantic models, and data quality in Power BI
  • Proven migration frameworks from Tableau, Qlik, Sisense, SSRS

Microsoft Solutions Partner

Explore our comprehensive suite of Power Platform services

Learn More

Our Perspectives

FAQs

Microsoft Power BI is a business intelligence platform for connecting to data sources, building semantic models, and creating interactive reports and dashboards. It supports everything from simple visualizations to enterprise-scale reporting with governed, standardized metrics across an organization.
A semantic model is the layer that defines your business logic: relationships between tables, calculated measures, and standardized KPI definitions, so every report draws from the same consistent definitions instead of recalculating logic independently. Without a well-designed semantic model, teams often end up with the same metric calculated differently across reports, which is where most numbers don't match problems in Power BI actually come from.
Power BI is Microsoft's business intelligence and reporting tool, while Microsoft Fabric is a broader, unified data platform that includes Power BI alongside data engineering, data warehousing, and real-time analytics capabilities. Power BI reports and semantic models run natively within Fabric, so adopting Fabric doesn't replace Power BI, it extends it with a shared data foundation across the wider analytics stack.
Power BI scales well with the right architecture behind it: workspace strategy, tenant-level governance, capacity planning, and role-based access controls tailored to your user base and data sensitivity. Row-level security and usage monitoring keep performance and access under control as adoption grows across departments.
Yes. Migrating from SSRS, Tableau, or Qlik to Power BI involves rationalizing existing reports, redesigning the underlying data model, and aligning KPI definitions so nothing gets lost in translation. A structured migration also validates outputs against the legacy system before cutover, to confirm the numbers still match.
Copilot lets users ask questions about their data in plain language and get back summaries, visuals, or new report pages without writing DAX or building charts manually. Its accuracy depends entirely on the semantic model behind it: clean, well-documented data models and measures produce reliable answers, while messy or inconsistent models produce misleading ones.
Power BI licensing (Pro, Premium per user, or Premium per capacity) and Fabric capacity both affect how much concurrent usage, data volume, and refresh frequency your organization can support. Choosing the right mix depends on usage patterns and concurrency, which is why most organizations run a licensing and capacity assessment before scaling Power BI enterprise-wide.
Dashboards stay reliable when they draw from standardized semantic models, optimized DAX measures, and consistent design patterns instead of one-off report logic. Ongoing governance, refresh strategy, and performance tuning keep dashboards fast and aligned with how the business actually makes decisions.

Build a trusted analytics platform beyond disconnected dashboards with our Power BI services.

Talk to Our Experts